Variance Model Instructions
The Variance Model is a Monte Carlo Analysis that can be used to:
- Review historical results to see how likely recorded profit has been under a sample size
- Test various stakes under a strategy to get an understanding of risk.
To use the model you will need to input:
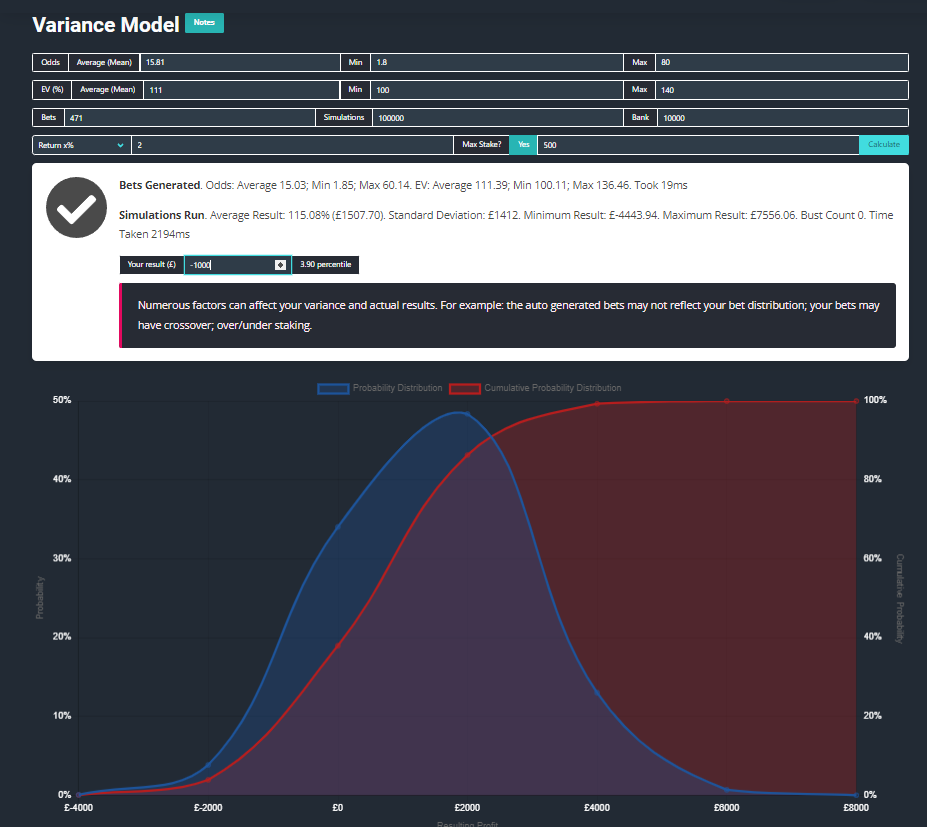
(1) Avg Odds e.g. 15.81 in my example below
(2) Min and Max Odds Optional, default is 1.8 to 80
(3) Average EV e.g. 111% in my example
(4) Min and Max EV Optional, default is 100%-140%
(5) Bets Sample size; 471 in my example
(6) Simulations Default 100,000. Higher Simulations mean a higher accuracy, however will take longer to process
(7) Bank £10,000 in my example
(8) Staking strategy 1. Return x% = Return x% of your bankroll; 2. Win x% = level staking to win x% of your bankroll; 3. Kelly staking.
A Rolling staking strategy means that stakes will increase with winners relative to an increase in bankroll
(9) Max Stake optional, default is £500.
Clicking the Green “Calculate” button will run the Monte Carlo analysis and generate the graph. The blue probability distribution (left Y axis) shows the likely distribution of profit under the input variables. For example I can see that I will break even with £0 profit / loss 28% of the time using my strategy. Hovering the mouse over the line on the graph in the live model will present a pop up with the x and y-axis figures. The red probability distribution (right Y axis) line shows the same curve in a cumulative probability distribution.
If we have a set of results to compare on the graph we can input into the field “Your Results” to see which percentile the results sit on. Anything < 50% is below the average expectation, anything > 50% is above the average expectation. In my example I can see that my observed results of -£1000 sit on the 6.16 percentile, something we would expect to occur roughly 1 in 16 times. I can use this information to determine whether to continue with my strategy or whether to adjust my staking strategy or staking levels.
